Monitoring Parallelization
Scope
This page demonstrates several ways to monitor jobs that are running in parallel, either on your master node or on compute nodes in the SGE grid.
SGE and Slurm job schedulers
This page primarily discusses using SGE as the job scheduler for submitting jobs to the grid. Blueprints 24-04 and later have the option to use Slurm (instead of SGE) as the job scheduler. See "SGE-to-Slurm Quick Start Guide" for information on using Slurm.
Monitoring Locally on the Master Node
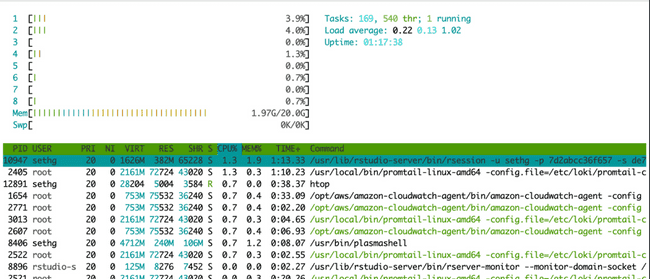
When running jobs in parallel on your master node, the easiest way to monitor if they're running (and using the expected number of cores) is to use the Linux utility htop. In your terminal (not your R console) type htop. This brings up the following visual:
The horizontal bar graph at the top tells you (among other things) about the cores on your machine and their utilization capacity. There is a bar for each core (each vCPU actually) and they will be lit up green to show percent utilization. The table below it shows all of your currently running processes. You might be amazed to see how many there are at any given time, and how little CPU most of them use. This is essentially the same thing you see in top, another common Linux utility for monitoring processes.
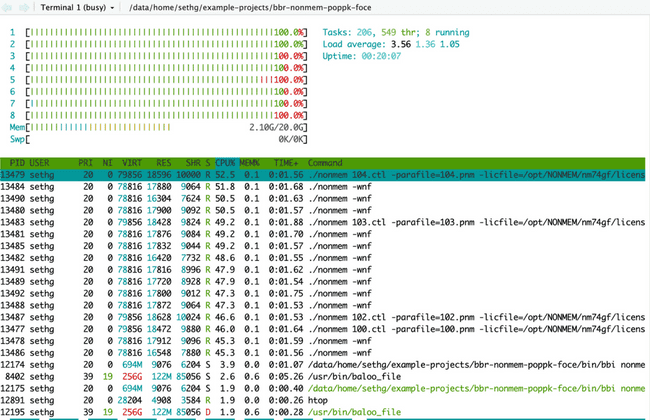
Below is htop after submitting eight NONMEM models, each using four cores. This is the first example under "Submitting Jobs to the Grid" in our "Grid Computing Intro". Notice all cores are lit up green because we have submitted more than enough work to use all available CPU resources.
You can quit at any time with ctrl+C or F10 and return to your terminal.
Monitoring on the Grid
If you're submitting jobs to the grid, you won't see them in htop because htop only monitors the master node.
However, there are several other tools for monitoring work being done on the grid. The following examples show monitoring from submitting eight NONMEM models to run on the grid using four cores for each model. This is the second example under "Submitting Jobs to the Grid" section in our Grid Computing Intro.
Grafana
Starting with the 21.08 release, Metworx is configured to display usage information in a Grafana dashboard. You can access this by adding grafana to the end of your workflow URL, such as https://i-0972bb95cd8cb78ec.metworx.com/grafana. You can find more information on the Getting Started With Grafana page.
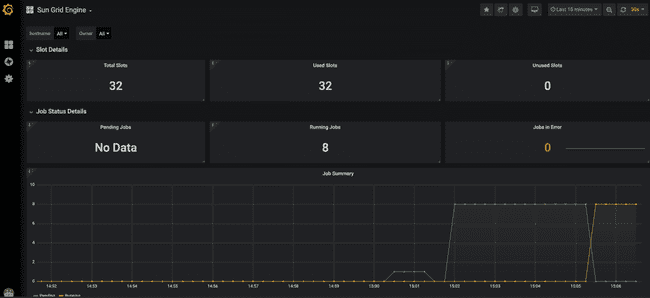
The top of the dashboard shows high-level stats about utilization across the entire grid.
Here we see that we have 32 available slots (or cores, see Grid terminology). This is because we have four worker nodes up, each of which has eight cores. Furthermore, you can see they are all in use since we submitted eight models and specified each to use four cores (8 * 4 = 32).
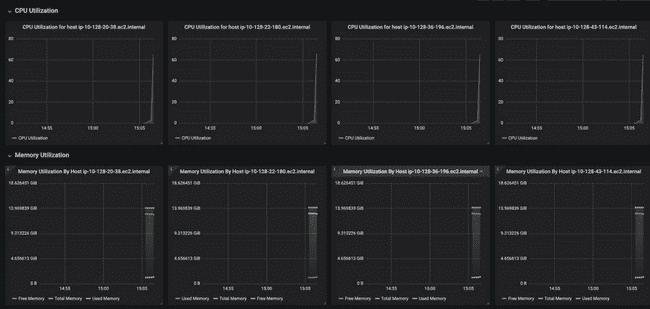
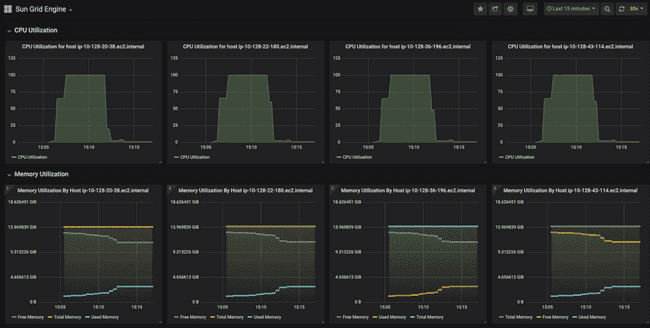
Below that, the dashboard shows CPU and memory usage for each worker node. Notice how each worker node has a small peak to the right-hand side, which shows they each have started working on a task (the job we submitted).
Below is ten minutes later when all the jobs have finished. You can see that CPU utilization on each node went to 100% for roughly seven minutes while the models were running. You can also see the "used memory" line creep up as the models run, though never coming close to using all the memory.
If you had looked at htop during this period you would not see any activity, because all processing was done on the worker nodes and htop, as previously stated, only shows activity on the master node.
qstat
You can also use the qstat command (also used in the terminal, not the R console) to show you the jobs currently queued or running on the grid. (The -f flag shows a more informative output.)
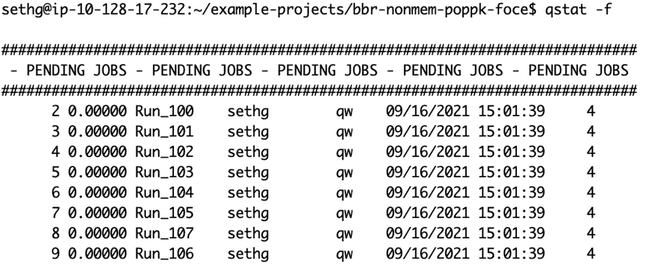
Here is qstat -f right after the jobs were submitted, before any worker nodes have come up to process them:
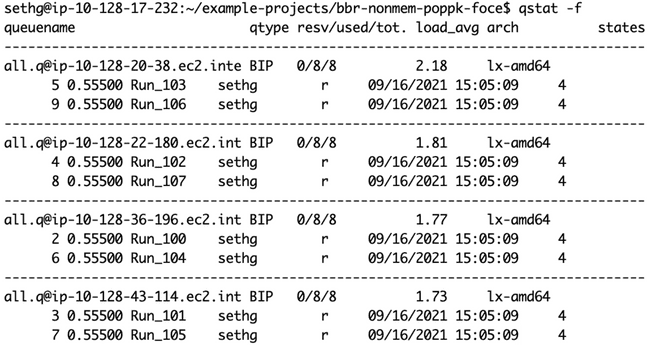
And here is qstat -f showing all eight jobs being processed simultaneously on four 8-core worker nodes, as shown in the diagram at the end of the "Submitting Jobs to the Grid" section of our Grid Computing Intro.
