Monitoring Workflows with Grafana
Scope
Starting with Metworx blueprint 21.08, you can use Grafana dashboards to monitor key metrics about your active workflows. This page demonstrates how to access and use Grafana to confirm that your compute resources are configured appropriately and to monitor your compute resources as you perform your work.
Accessing Grafana
To access Grafana append /grafanato the end of your workflow URL. For example, the workflow URL would look something like https://<unique-workflow-id>.metworx.com/grafana/. To obtain the URL of your workflow, launch an RStudio session and use the URL in your browser (replace /rstudio... with /grafana).
Grafana is password protected. To log in, use your workflow username and password--the same way you log into a new RStudio session or to Guacamole (remote desktop).
Using Grafana Dashboards
Grafana allows you to monitor activity on your workflows via two different dashboards, one corresponding to activity on the head node and the other corresponding to activity on the grid.
Head Node Dashboard
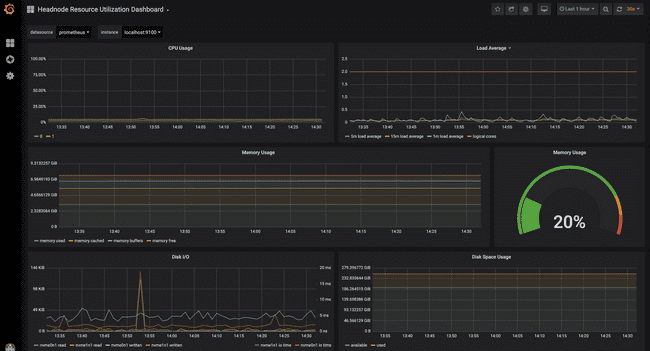
The Headnode Resource Utilization Dashboard allows you to monitor activity taking place on your head/master node of your workflow. It provides key metrics related to CPU, memory, and disk space usage.
Note: The disk space usage noted on the dashboard corresponds to the server itself, not the /data folder where your home directory is located.
To evaluate your ongoing activity and resource utilization on the head node, open the Headnode Resource Utilization Dashboard in Grafana and adjust the time range and refresh interval by using the drop-downs located in the top-righthand corner of your screen. You can now have the dashboard open side-by-side with your ongoing work to see how your activity utilizes the resources on your head node.
Grid dashboard
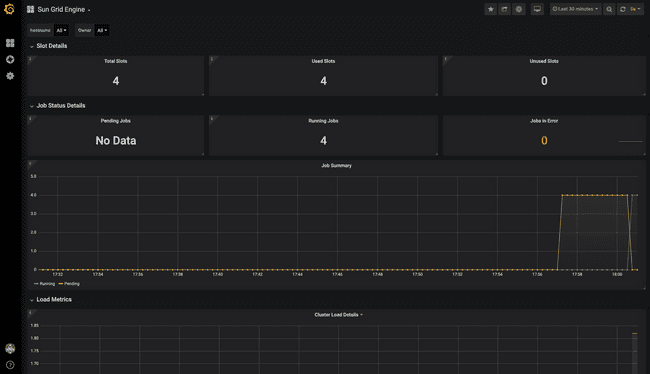
The Sun Grid Engine (SGE) dashboard is how you can monitor information about the jobs that you submit to the grid. Use the SGE dashboard to confirm that your jobs are configured as expected upon initial submission and to monitor the status of your ongoing jobs. For an example of using Grafana to monitor NONMEM models running on the grid, see the page on Monitoring Parallelization.
Specifically, the SGE dashboard provides the following information:
- Slot allocation (used/unused)
- Job allocation (running/pending/error)
- System load (repeated for every node in the cluster)
- CPU utilization (repeated for every node in the cluster)
- Memory utilization (repeated for every node in the cluster)
SGE uses "slots" to refer to the total number of cores available on worker nodes in the grid. "Used slots" are cores that have a job currently running on them.
In addition to the drop-downs for time range and refresh rate, the SGE dashboard also has drop-down filters (located in the top-left of your screen) for hostname and owner.
Changing your selections in the drop-downs prompts Grafana to redraw all of the panels and can be used to force a refresh of the data. You can also refresh your browser to refresh the data.


