Monitoring Workflows with Grafana
Grafana Introduction
Starting with the 21.08 Metworx series, Grafana Dashboards are now an out-of-the-box feature included on Metworx workflows. The goal of these dashboards is to present key metrics to users to help them monitor their active workflows.
The Metworx Team understands the importance of securing access to user's workflows and its associated information. Only workflow users can access the Grafana dashboard specific to their workflows, using the same username and password as to log into RStudio and Guacamole (remote desktop).
Accessing Grafana
Grafana is accessible at a protected end point, similar to other Metworx workflow components (i.e. RStudio, which is accessible at /rstudio). Users can navigate to Grafana one of 3 ways:
- Via the Grafana button on the Metworx Dashboard after a user launches a new workflow.
- By directly modifying the workflow url, having the base url end in
/grafana. For example, the workflow url would look something likehttps://<unique-workflow-id>.metworx.com/grafana/ - Via the Grafana button at the workflow's root url.
Using Grafana Dashboards
Grafana allows users to monitor activity on their workflows. There are 2 separate dashboards available via Grafana, one corresponding to activity on the head node and the other corresponding to activity on the grid.
Head Node Dashboard
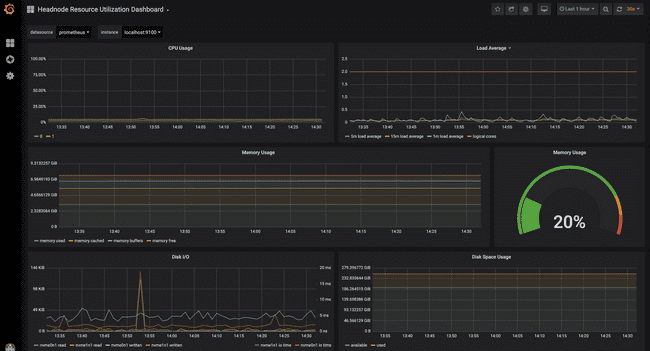
The Head Node Dashboard allows users to monitor activity taking place on the head node of their workflow. It provides key metrics related to information like CPU, Memory, and Disk Space Usage.
- Note: the disk space usage noted on the dashboard corresponds to the server itself, not the
/datafolder where users' home directories are located.
If at any time a user wants to evaluate their ongoing activity and resource utilization on the head node, they can open the Head Node dashboard in Grafana. After adjusting the Time Range and Refresh Interval options (located at the top right-hand corner of the screen), the user can have the dashboard open side by side with their ongoing work. With a slight delay, the user will see how their work utilizes the resources available on their head node.
Grid Dashboard
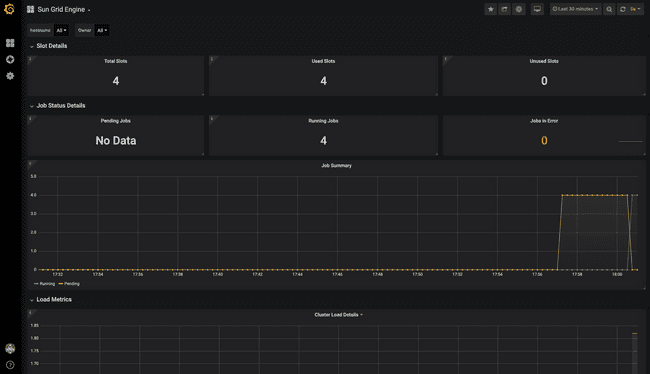
The Grid Dashboard (Sun Grid Engine) provides information to users about jobs they submit to the grid. It can allow users to confirm their jobs are configured as expected upon initial submission and they can monitor the status of their ongoing jobs. Specifically, the Grid Dashboard provides the following information:
- Slot Allocation (Used/Unused)
- Job Allocation (Running/Pending/Error)
- System Load (Repeated for every node in the cluster)
- CPU Utilization (Repeated for every node in the cluster)
- Memory Utilization (Repeated for every node in the cluster)
In addition to the Time and Refresh Interval dropdowns, there are some additional dropdowns specific to the Grid Dashboard. One for hostname, and one for the user. These allow you to filter the dashboard itself to either look at one, many, or all of any combination of known values.
Changing your selections in the drop-downs will trigger Grafana to redraw all of those panels, and is often used to force a refresh of the data. This would be a scenario you expect to see a panel for a host but do not yet. Selecting a new value and going back to all, for example will re-draw the dashboard. Also, just clicking refresh in the browser will accomplish the same.


