Testing the Metworx Organization Configuration and TroubleShooting issues
Step-by-Step Video: https://s3.amazonaws.com/metrumrg-video/metworx/metworx_support_video/metworx-testing-org-setup.mp4
Once all of the previous steps are taken, you should not see any fields highlighted in red on the dashboard, AND one or a few workflow versions should be available to launch.
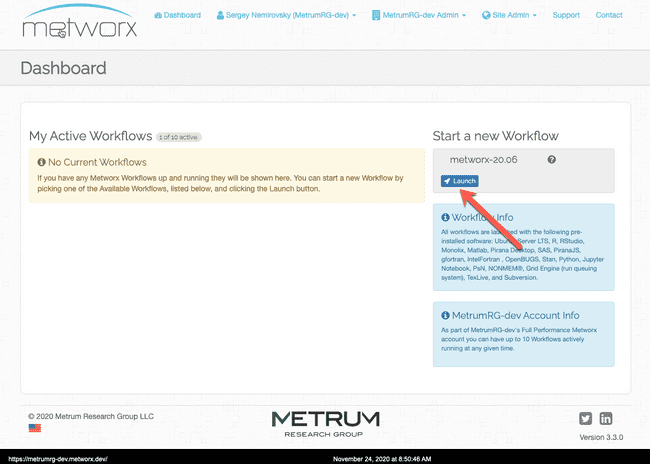
The next step, is to launch the workflow
- Click on "Launch" to initiate workflow configuration
- Configure the test workflow
a. Provide name (at least 4 characters, letters and numbers only)
b. For this test, select initial size 1 (so one master and one compute node will be provisioned)
c. Type in a new disk name and select size of 5GB
d. (only if workflows in public subnets) Leave the CIDR address for in the AccessFrom Field as pre-populated value.
e. Provide password to be used to log in to the created workflow
d. Accept the Metworx Services Agreement.
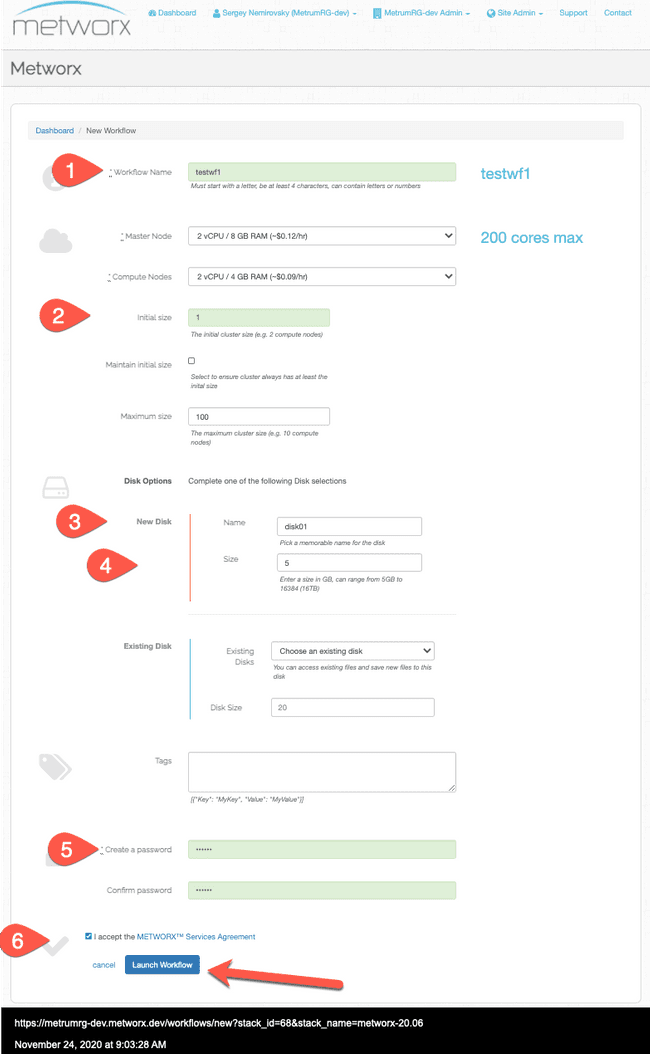 Leave all other values unchanged on the workflow form and click on "Launch Workflow".
 - If all goes well, this would initiate workflow creation process and you should see the next screen.
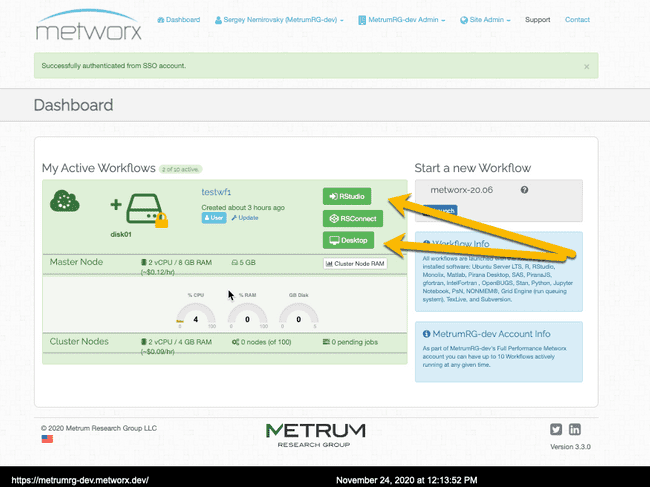
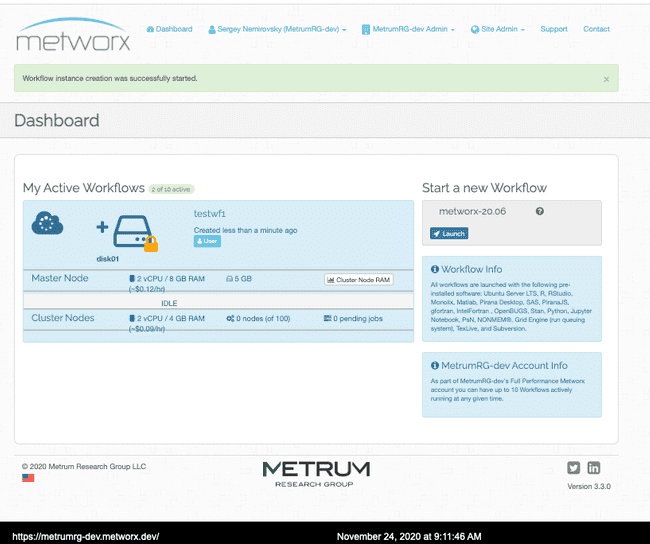 . Workflow creation takes about 15 minutes, and, once successful, the workflow will turn green on the dashboard AND applications (Rstudio, Desktop and RSConnect links will show up)
 - ON AWS Console, a CloudFormation stack will launch. You can see the events from stack creation and resources created in CloudFormation Console a. Login to the AWS account with sufficient privileges
b. Go to Service-> CloudFormation in the correct AWS Region
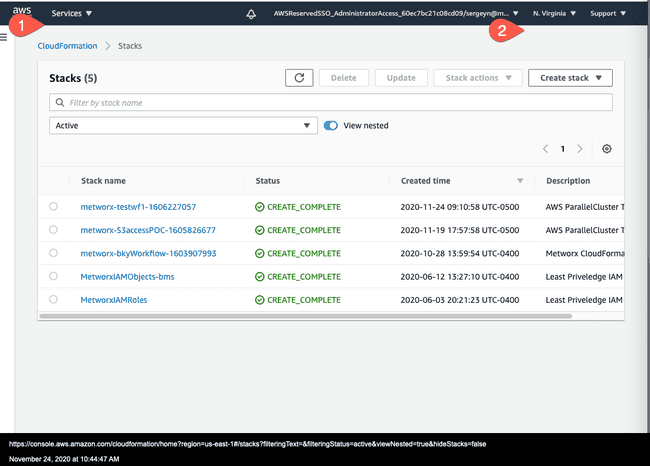
c. Select correct CloudFormation stack. It will be named metworx-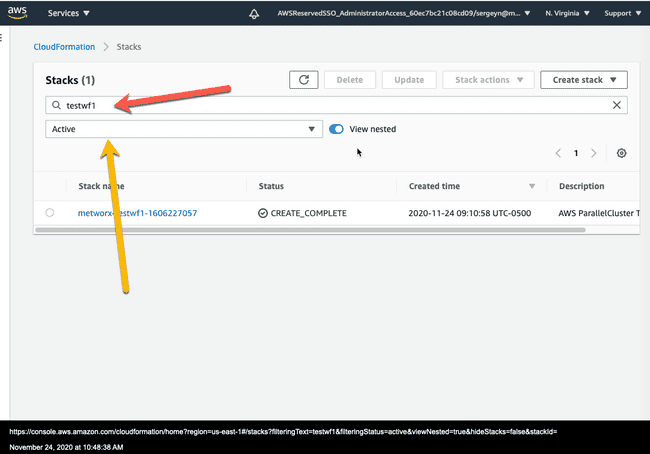
d. Under CloudFormation Stack view, you can see Events (including errors), as well as resources created by the CoudFormation Stack
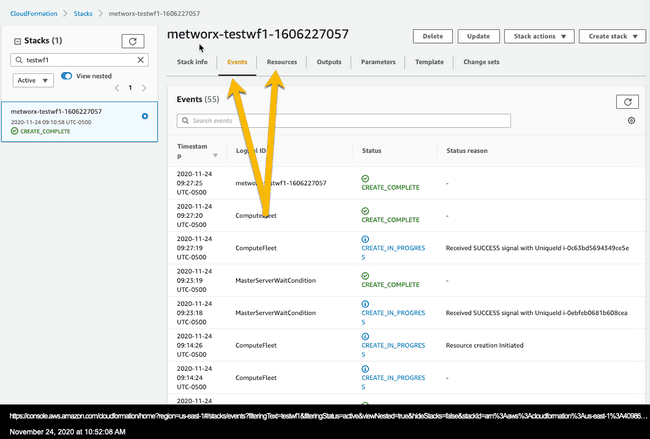
- You might see from CloudFormation events that a Master or Compute node failed to create. The events will also have instance id for the ec2 instance of the failed node. You can view some of the logs from the failed instance in CloudWatch Logs
a. From CloudFormation events (or Resources tab), identify instance id. (copy, i-0ebfeb0681b608cea in this case)
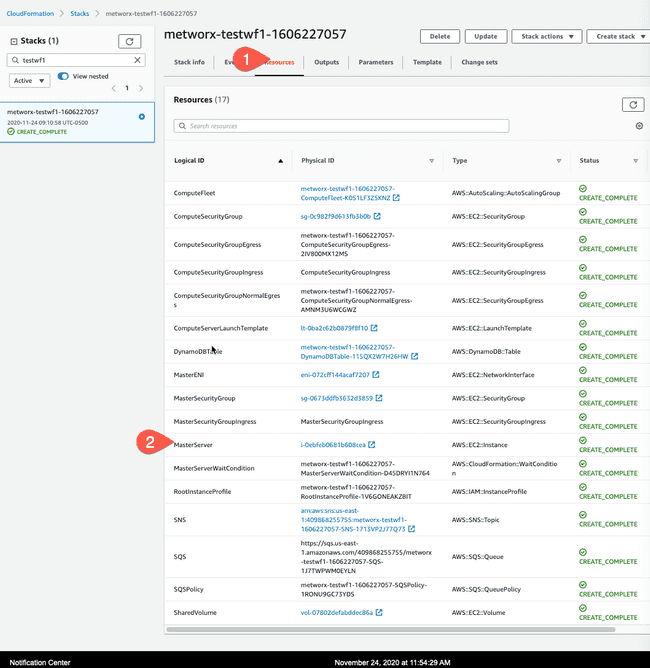
b. Go to Services->CloudWatch, and select log groups.
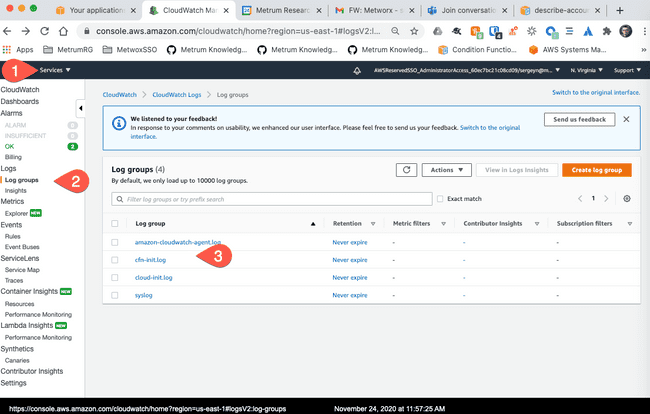 You should see several log groups, cfn-init.log, cloud-init.log, and syslog are associated with the Metworx nodes. Most often, you want to look at cfn-init.log for node provisioning issues
c. Click on cfn-init.log log group, you will see the logs for every node (named after instance id)
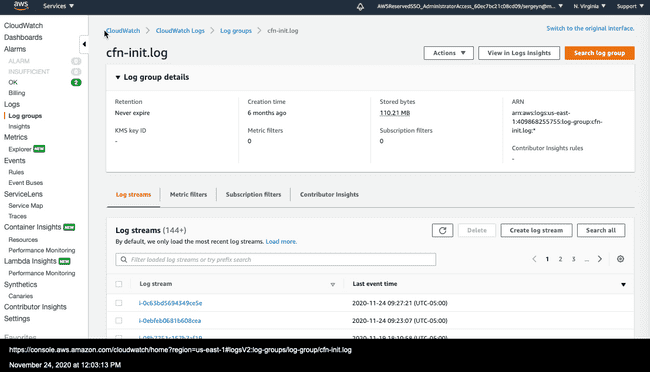 . In the search field, paste the instance ID for the node collected in the previous step to quickly find related log. You then can click on the CloudWatch log stream to view the logs
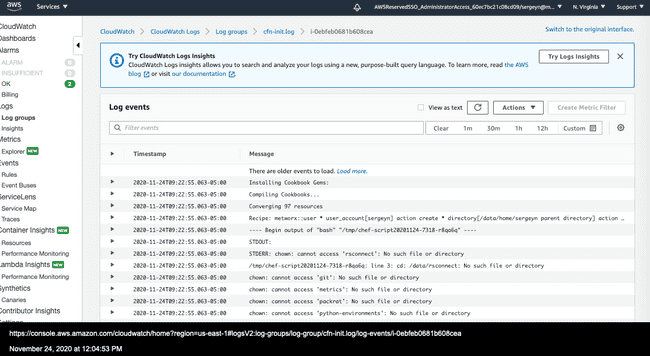
- If workflow is created successfully, you will see it turn green with links for the Rstudio, Desktop and RSconnect display. If workflow creation fails, the workflow will turn red on the dashboard, please review the logs as described above to identify the reason for failure. For assistance, please open "Onboarding Request" ticket type in the Metworx Support Portal
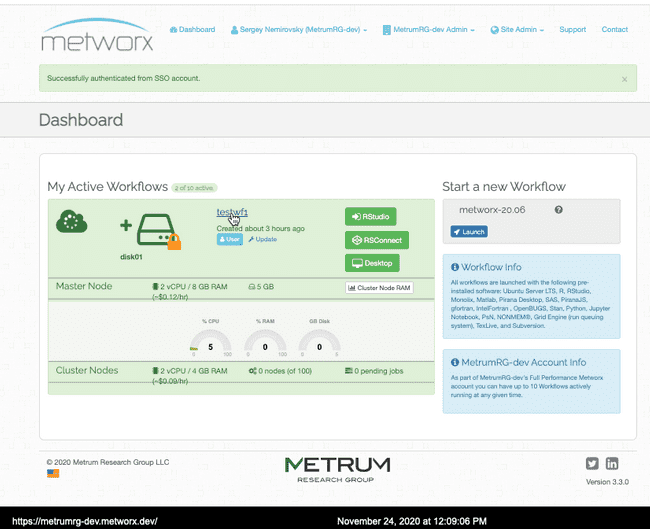
- Test functionality by clicking and logging in to Rstudio and Desktop interfaces of the newly provisioned workflow.
